Explore the system.
Connect resources and processes to components, infrastructure, end markets, IP, and policy. Make hidden dependencies and shared bottlenecks visible across industrial boundaries.
COMPUTATION & VISUALIZATIONDecision intelligence for the transition economy
Understand the industrial systems beneath the economy. Trace how change propagates. Identify where intervention can create strategic advantage and convex returns.
Systems topology · Convexity · Context steering · PolicyResources · IP (intellectual property) · Capabilities · Firms & assets · Ecosystems · InfrastructureThin waist potential
01 / The platform
CASCAIDIENT is a computational observatory examining 115 industry clusters, $10T in physical production, $100T in market capitalization: connecting evidence about materials, intellectual property, technologies, productive capabilities, firms, assets, equity performance, and policy to the decisions they constrain or enable.
Connect resources and processes to components, infrastructure, end markets, IP, and policy. Make hidden dependencies and shared bottlenecks visible across industrial boundaries.
COMPUTATION & VISUALIZATIONExplore how policy, supply, technology, and demand shocks travel through a system. Examine where capacity, qualification, substitution, and timing change the outcome.
CONSTRAINTS & SCENARIOSAssess thin waist potential to identify where to invest, partner, redesign, or build capability. Seek positions whose upside can accelerate as the system changes.
RESILIENCE & CONVEXITYA productive capability can require many inputs, specific processes, infrastructure, IP, enabling policy, and qualification at once. Our computational objects represent these joint requirements, keeping the conditions for a feasible pathway in view.
Where can many upstream inputs and downstream applications converge through a small set of shared capabilities, interfaces, or intellectual property? These positions can enable broad participation while concentrating strategic influence and value capture. Assess their potential through adoption, substitutability, control of access, and the ability to scale.
02 / Platform direction
We connect a continuously evolving evidence base and computational objects with dynamic models and agentic analysis enabling decision makers to investigate the interconnected industrial economy and how the system may adapt under transition and disruption.
Maintain traceable representations of industrial capabilities, dependencies, facilities, and policy conditions.
Represent constraints, feedback, substitution, and adoption to compare conditional pathways through change.
Develop agents that investigate evidence, test alternatives, and support decisions within explicit assumptions.
The operating premise
Strategy is exploiting and shaping the complexity and dynamics of the transition economy.
03 / Decisions that matter
Where should we build capability, secure inputs, redesign products, or form partnerships?
Capital allocation · resilience · market entryWhich firms and assets occupy positions that become more valuable as constraints shift?
Structural exposure · substitution · adoptionWhich intervention expands feasible production—and what bottleneck would emerge next?
Productive capacity · infrastructure · qualification04 / In practice
Move from industrial structure to strategic choice. Explore platform views that connect ecosystems, scenario cascades, firm positions, and the conditions that reshape them.
Explore: the platform captures connections and navigates industry details to highlight their strategic implications.
01 / Explore the system
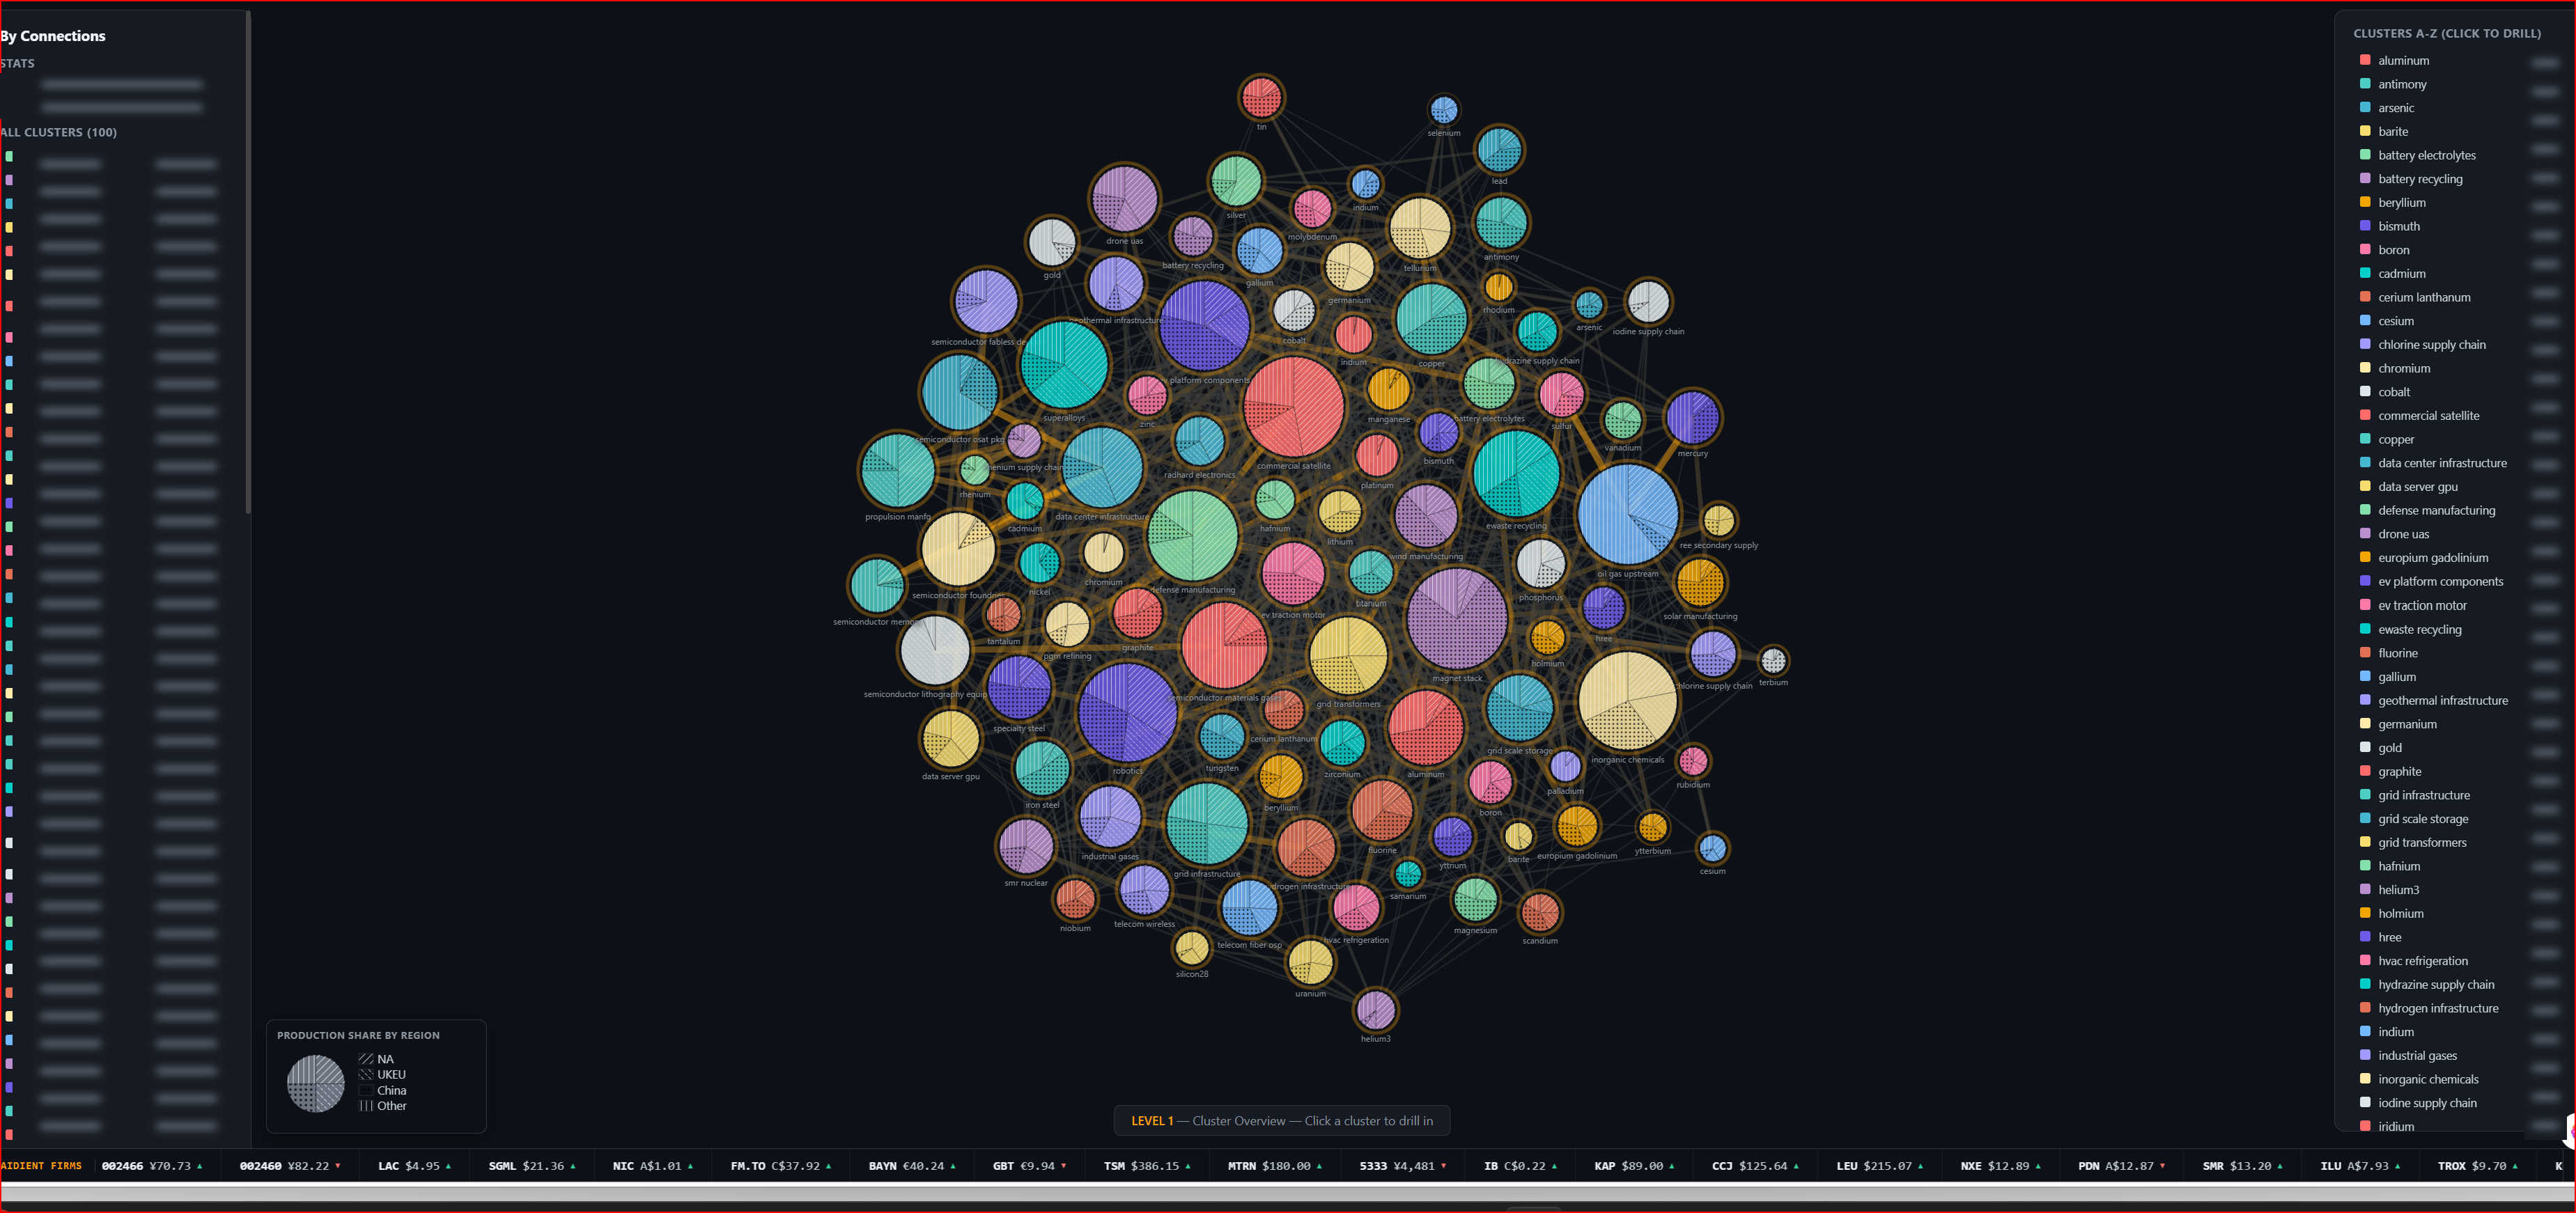
Locate an industrial ecosystem, follow its connections, and examine the capabilities and organizations that give it shape.
© 2026 CASCAIDIENT. All rights reserved.
The cluster overview places industrial ecosystems in a shared field. Connections between clusters reveal where an apparently local dependency reaches into another part of the economy.
Where should we look beyond a sector boundary to understand a strategic dependency?
02 / Trace the cascades
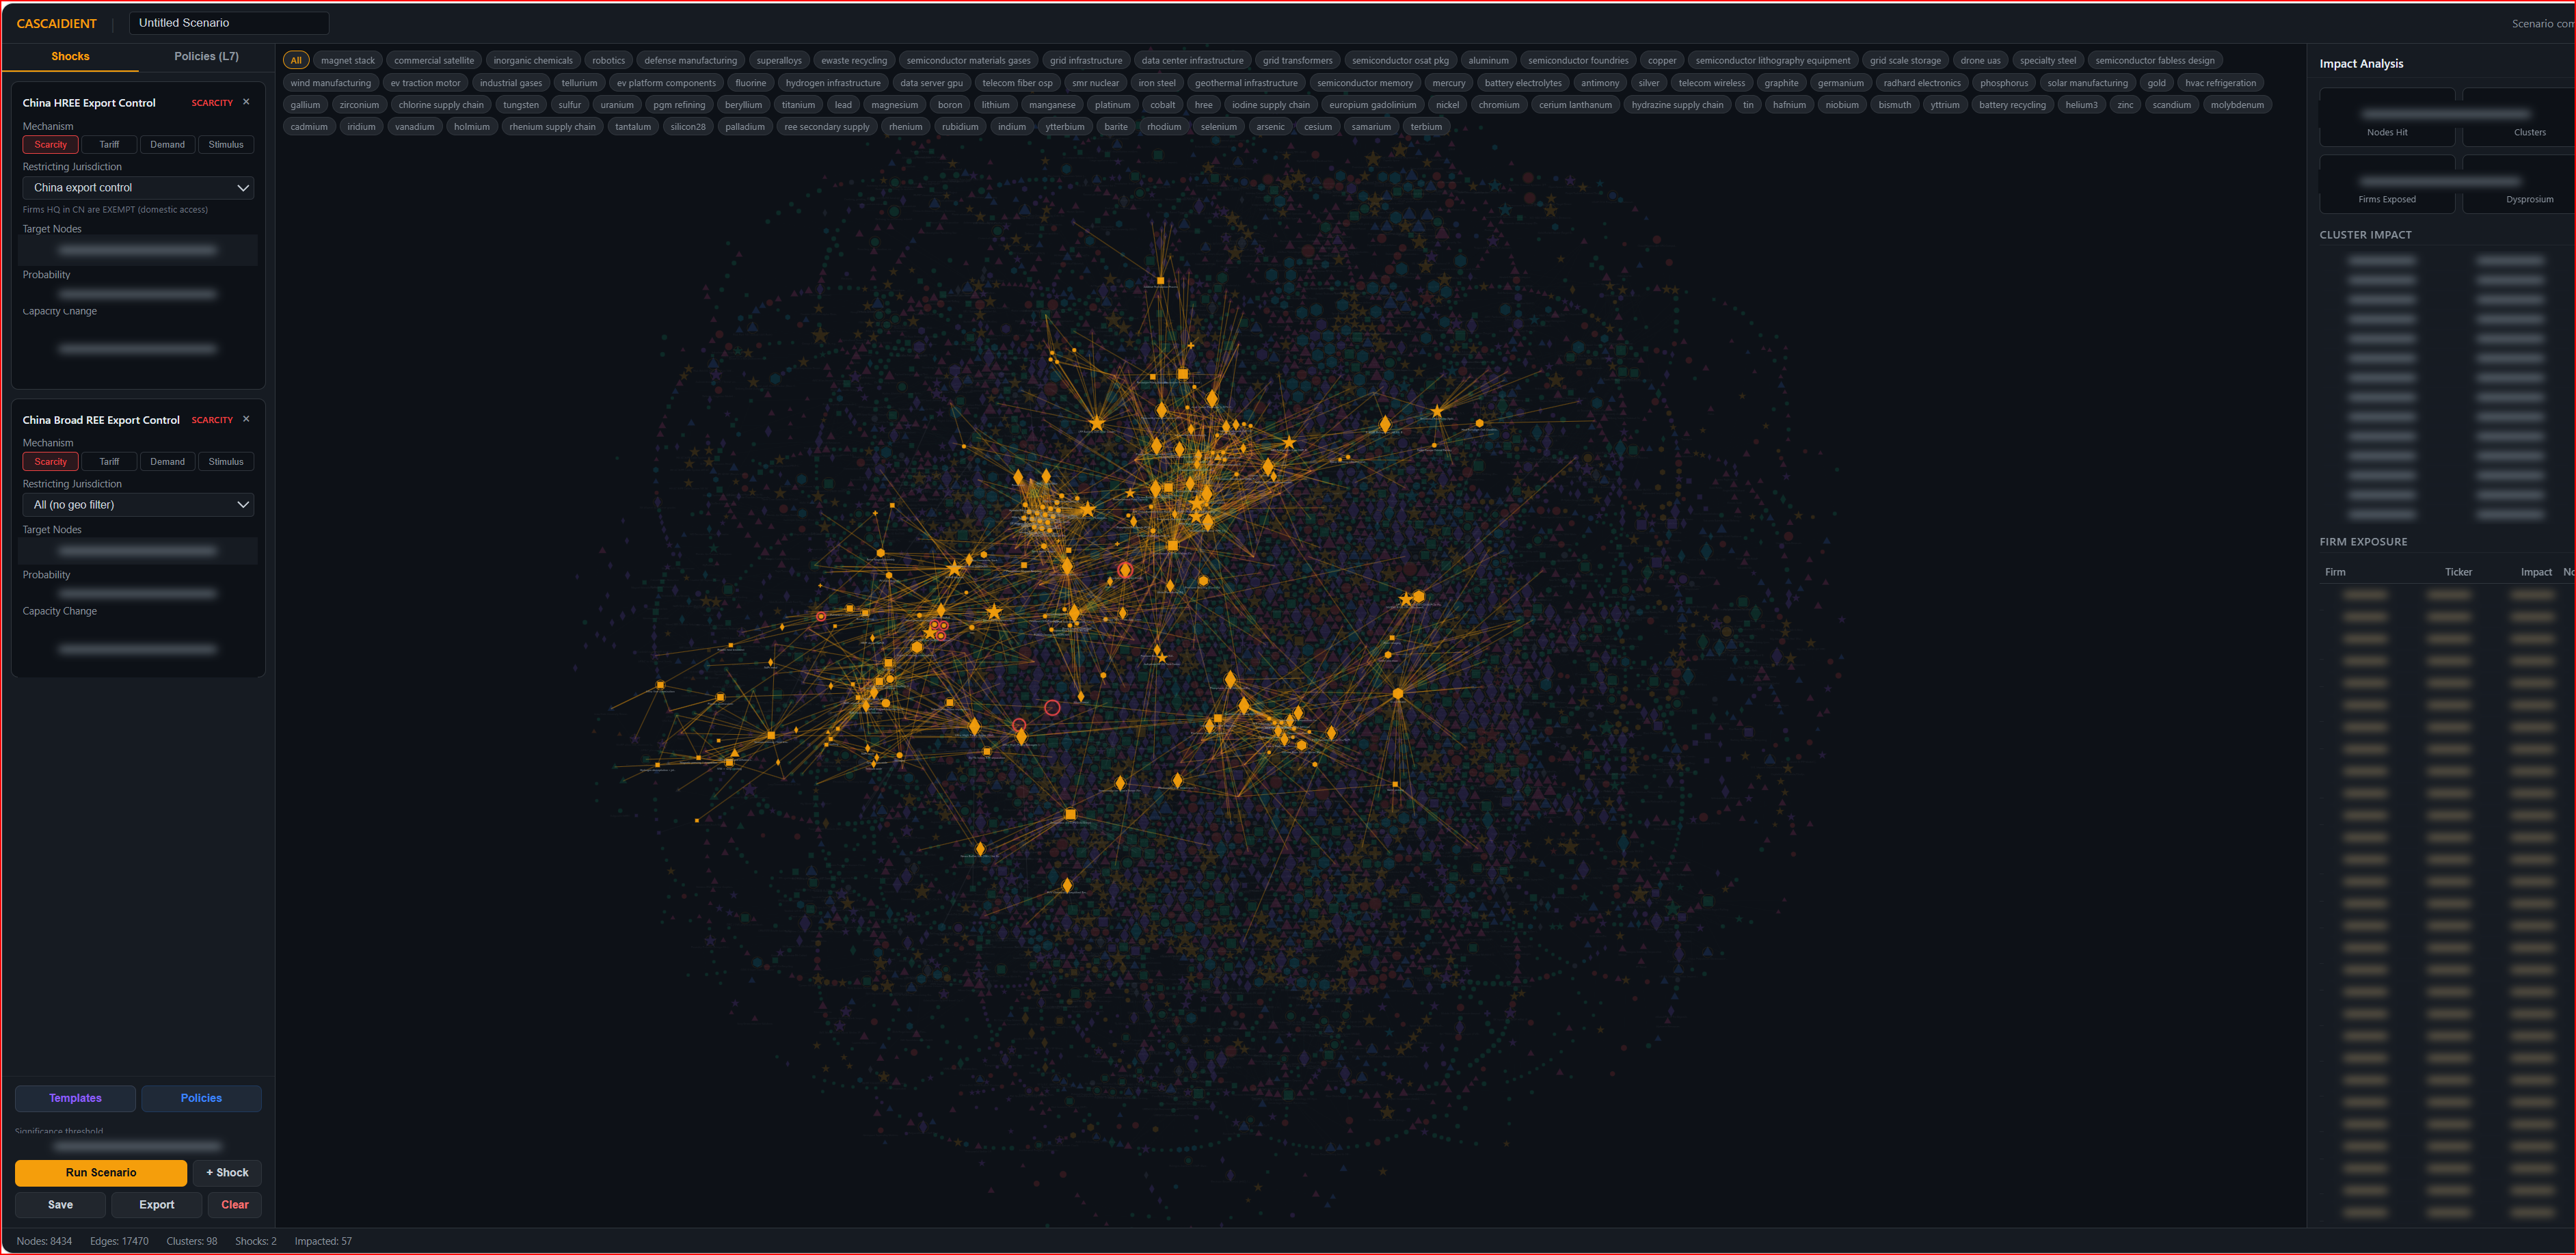
Examine how a supply restriction, a demand shift, or a disruption can propagate through dependencies—and how assumptions change the exposure.
© 2026 CASCAIDIENT. All rights reserved.
A rare earth export-control scenario connects configured shocks to affected nodes, clusters, and firms. The network provides a route from the initial constraint to the wider industrial exposure.
Which downstream activities share the constrained inputs, and where should alternatives be investigated?
03 / Examine positions
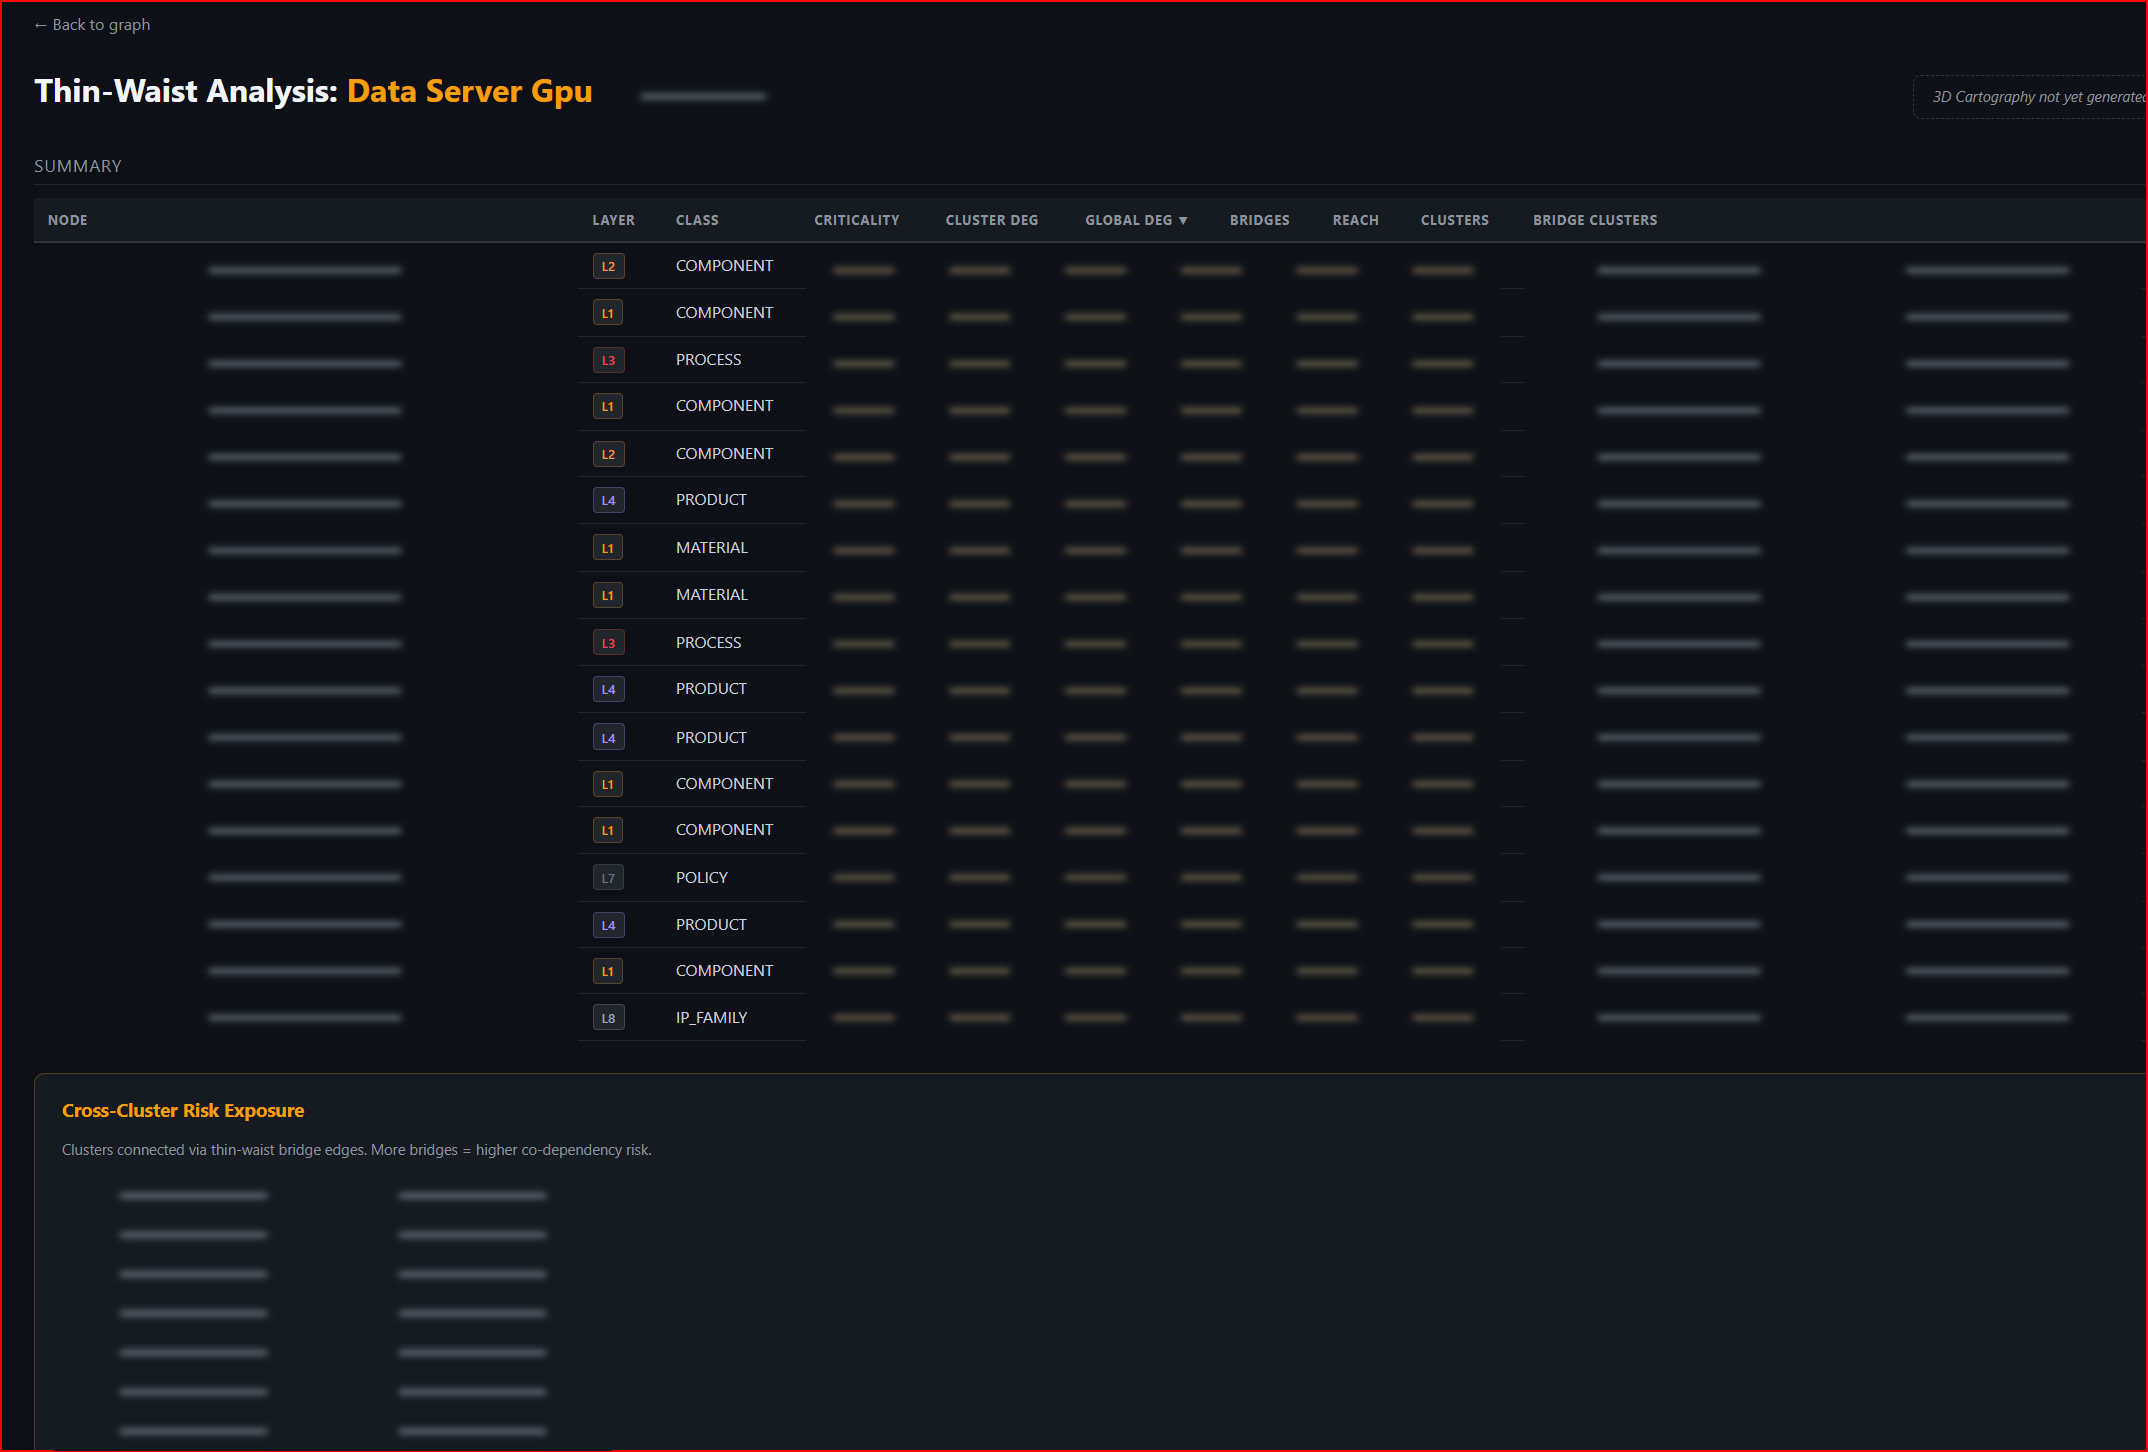
Compare firm footprints, locate thin waist potential, and trace pathways to end uses and intellectual property. Each view adds a different lens on where to build, partner, or invest.
© 2026 CASCAIDIENT. All rights reserved.
The data server GPU analysis brings candidate chokepoints into a ranked view, with structural measures and exposure across clusters. The ranking helps focus investigation of access, substitution, and control.
Which shared capability could create strategic influence—and what would make that position durable?
04 / Monitor conditions
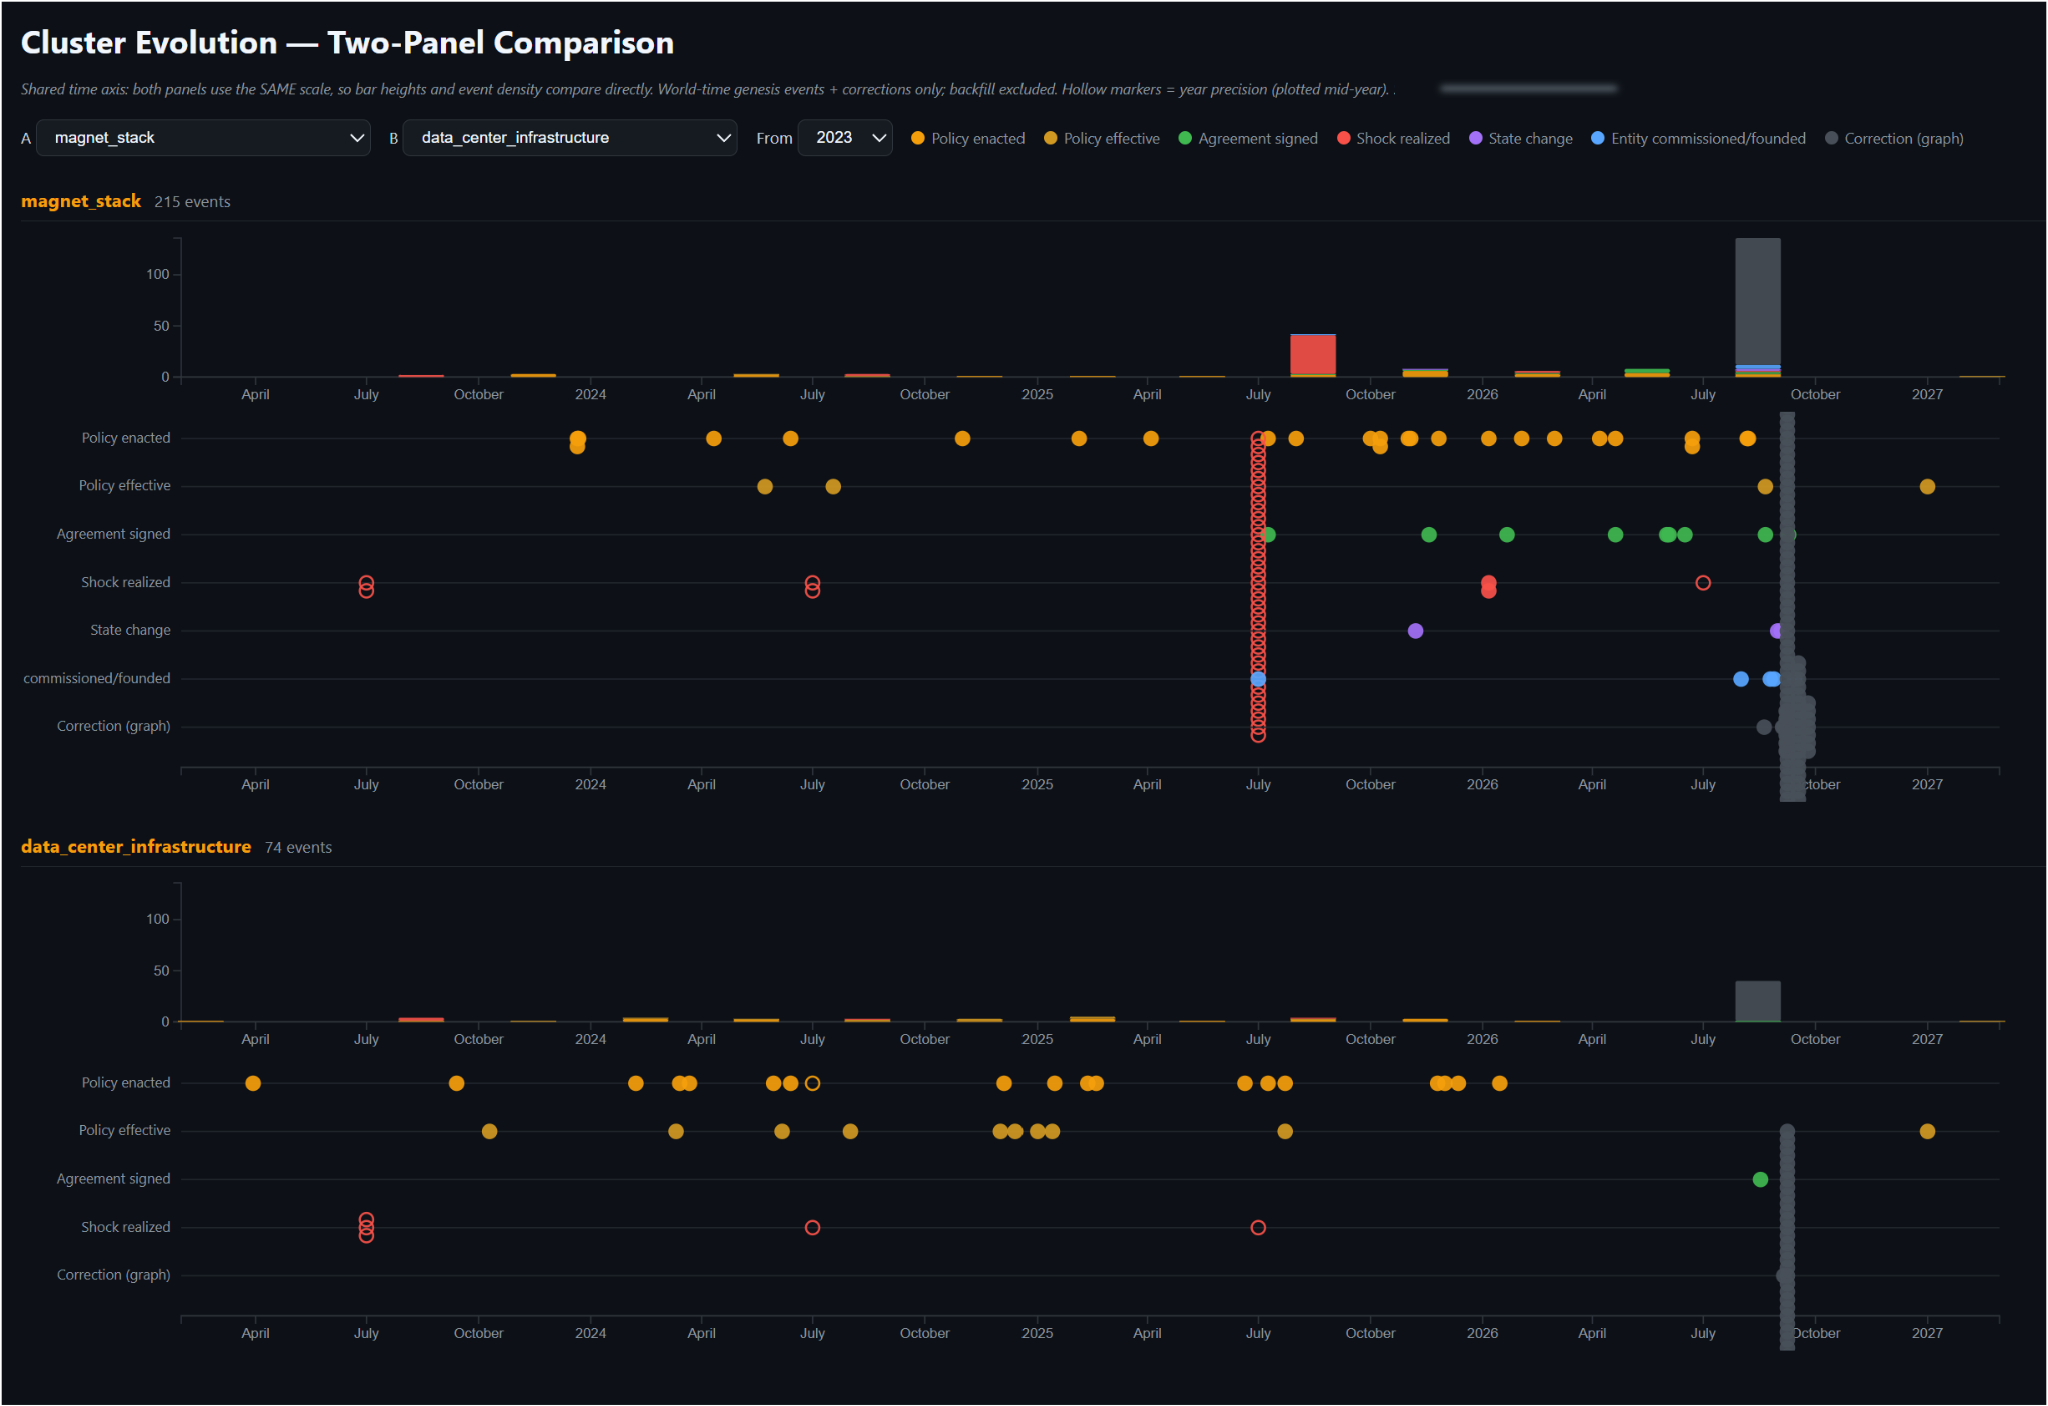
Follow how policy and industrial events unfold across ecosystems, then examine the operating conditions that can reshape a strategy. Compare cluster histories and bring policy, demand, and capacity into view.
© 2026 CASCAIDIENT. All rights reserved.
Compare the magnet and data center infrastructure ecosystems on a shared time axis. Policy enactment and effective dates sit alongside agreements, shocks, commissioning, and state changes, creating a record for investigating how policy reshapes industrial capabilities and relationships.
Which policy changes precede shifts in industrial capabilities, and what evidence connects the policy to the structural response?
These selected platform captures preserve the interface and visual structure. Softened areas mark withheld values, model details, and selected identifiers. Visible scenario values are conditional estimates of exposure. Policy and market readings belong to each capture’s date.
05 / Evidence by design
Deep provenance is a design principle. A dependency needs evidence of the relationship itself. Capacity needs a defined scope. An announced project needs a status and a date. A shock needs calibrated on history.
Observed fact. Calibrated mechanism. Explorable scenario. Constantly updated.
Keep the distinction visible.
Trace a specific claim to its source, document location, observation period, and known limitations.
Distinguish theoretical substitution from a route that meets performance, qualification, scale, and timing requirements.
Separate proposal, commitment, funding, and effectiveness. Preserve the difference between nameplate capacity and qualified output.
Keep unknowns and unsupported claims visible. Use quantitative relationships only when their basis can be reproduced.